12 Business KPIs: Definitions You Can Trust and Decisions You Can Explain
Define sales, inventory, delivery and cash metrics with clear cohorts, accurate formulas and useful exceptions. A worked example without invented causal claims.
Penulis
Anichur Rahaman
1 bulan yang lalu8 menit baca190 tampilan
Monday morning. A retailer sees 50,000 of net order value on one report and 52,000 of recognised revenue on another. Before asking someone to “fix the numbers”, she asks what each report counted. The question changes the meeting: the team needs definitions before another chart.
This is an illustrative scene, not a customer case study. A useful dashboard must explain its numbers and the decisions they support. More charts cannot repair a missing definition.
This 2026 guide offers twelve possible metrics, not a universal dashboard size. Give each a definition, reporting scope, accountable owner and decision. We will calculate a worked example and show why a red tile starts an investigation rather than proving its cause.
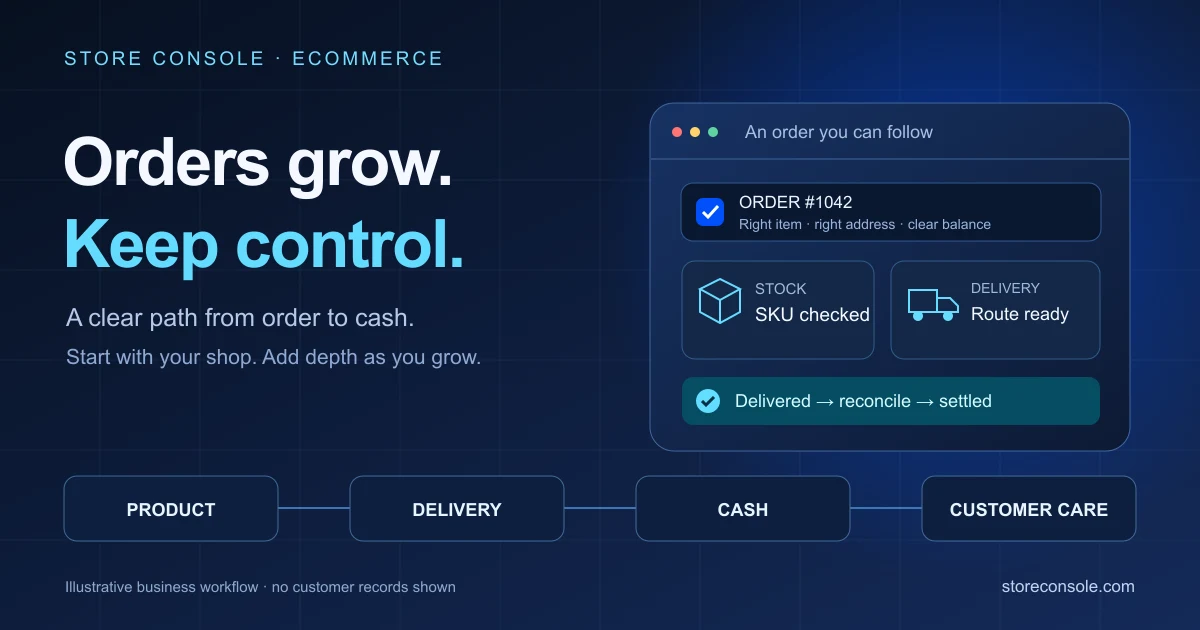
Choose metrics for real decisions. Shared definitions connect the views; arrows do not prove causality.
Why dashboards go unread
Two dashboards may disagree because they measure different facts: orders accepted, payments collected or accounting revenue recognised. That is not necessarily an error. Name the measures accurately and reconcile their timing and exclusions; do not force them to match by calling all three “sales”.
Write a metric contract: numerator, denominator, cohort, time zone, currency, exclusions, source, freshness and version. A query implements that definition; it does not replace the business decision. Finance approves revenue and cost policies. A payment or order status alone does not determine recognised revenue.
What one source of truth looks like
One trusted definition can feed a governed reporting model without forcing every module into one direct database join. Snapshots or live views are both valid when their lineage, access limits and freshness are clear. Show when a snapshot was calculated and which inputs were missing.
Version the definition. If it changes, annotate the break or deliberately restate history with a reproducible method. Do not silently compare unlike series. A shared reporting store must still enforce role and location scope: a cashier does not gain access to payroll, all margins or every customer merely because the data is nearby.
Results, signals and evidence
Financial results describe completed activity; operational signals can help investigate what may happen next. Neither conversion nor stock accuracy guarantees future profit. A relationship between metrics is a hypothesis until supporting evidence is checked.
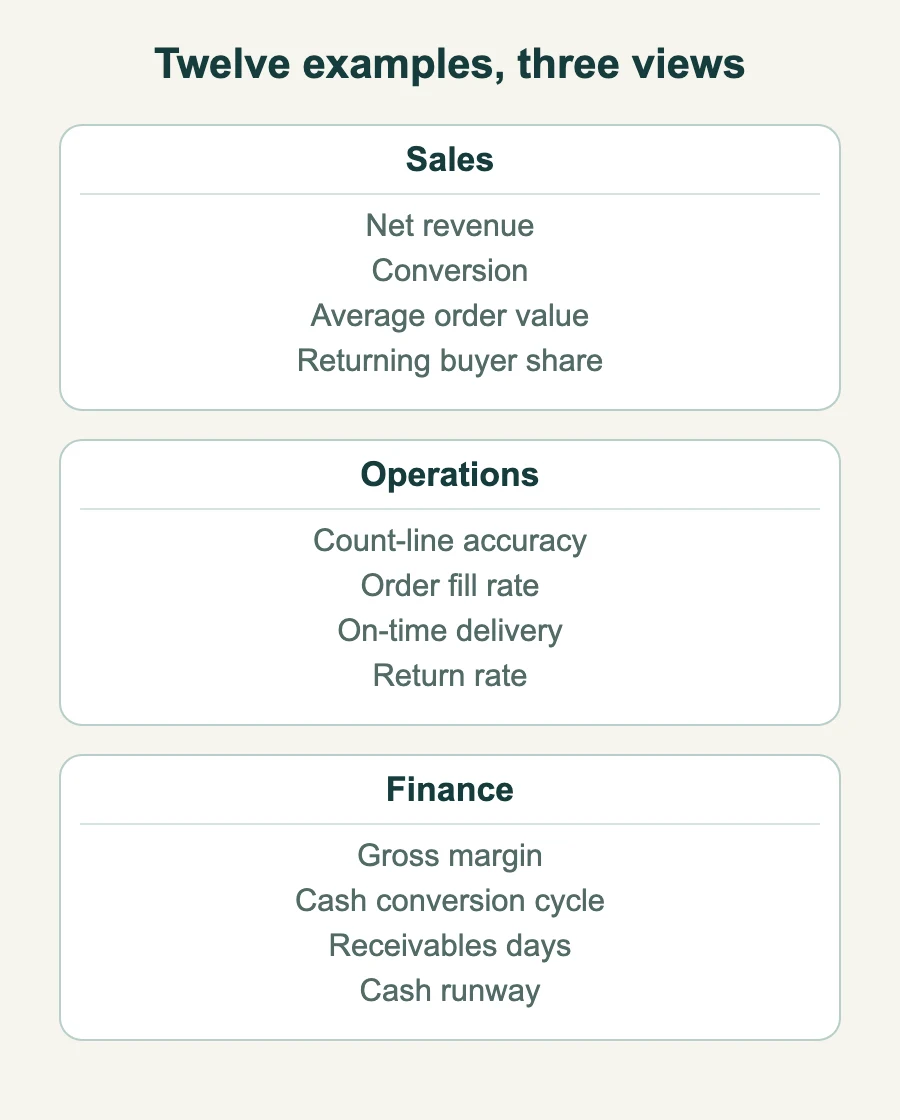
Sales, operations and finance answer different questions. Demand may be strong while fulfilment is weak, or revenue may grow while cash is tied up. Use the overview as a menu, then select the measures that support an actual decision.
Useful controls may protect safety, service, privacy or compliance even when their immediate profit effect is not measurable. Avoid calling every non-financial measure decoration. Each visible metric should have a purpose, an owner and a proportionate response.
The twelve KPIs, with formulas
The twelve examples below need local definitions. Rate formulas show percentages. Fix the cohort before computing them; zero denominators mean “not applicable”, not automatically zero performance. Do not silently remove failing orders from the cohort.
KPI
Formula
Cadence
Owner
Net revenue
Finance-approved recognised net revenue, with stated tax, discount and returns policy.
Daily
Head of sales
Conversion
Purchasing sessions ÷ eligible sessions × 100.
Daily
E-commerce lead
Average order value
Net value of eligible orders ÷ those orders.
Daily
E-commerce lead
Returning buyer share
Buying customers with an order before the period ÷ buying customers in the period × 100.
Orders complete at first dispatch ÷ eligible orders due for first dispatch × 100.
Daily
Operations lead
On-time delivery
Orders delivered by promise ÷ all eligible orders with promise already due × 100.
Daily
Operations lead
Return rate
Returned units ÷ fulfilled units in the same defined, matured cohort × 100.
Weekly
Operations lead
Gross margin
(Recognised net revenue − COGS) ÷ recognised net revenue × 100.
Weekly
Finance
Cash conversion cycle
DIO + DSO − DPO; consistent period and bases.
Monthly
Finance
DSO
Average trade receivables ÷ net credit sales × period days.
Monthly
Finance
Cash runway
Unrestricted usable cash ÷ forecast monthly net cash burn, only if burn is positive.
Monthly
Owner
Order fill rate and unit fill rate are different. Count-line accuracy is not stock-value accuracy. On-time delivery should include orders already due but still undelivered, or the metric can hide the worst delays. Mark returns cohorts as provisional until their agreed return window matures.
One month, worked through
Teaching example, with invented currency units and no industry targets. Use a 30-day financial period, plus explicitly defined operational cohorts. Net order value and recognised revenue are separate here: 50,000 and 52,000. They are not interchangeable. The working table also shows DIO and DPO, the components needed for the cash cycle.
40,000 eligible sessions; 1,000 purchasing sessions and, in this example, 1,000 qualifying orders with net order value 50,000.
780 buying customers, 312 with an order before the reporting period. Recognised net revenue 52,000; COGS 33,800.
1,000 eligible orders due for first dispatch; 940 complete on first dispatch. 1,000 deliveries already due; 960 delivered, including 864 on time.
A separate matured returns cohort: 2,400 fulfilled units and 168 returned. A count sample: 400 SKU-location lines, 368 matching.
Average inventory 67,600; average trade receivables 6,000; net credit sales 12,000; average trade payables 25,350; net credit purchases 33,800.
Usable cash 54,000; assumed future net cash burn 6,000/month. The resulting nine months is a scenario, not a liquidity guarantee.
Metric
Arithmetic
Result
Conversion
1,000 ÷ 40,000 × 100
2.5%
Average order value
50,000 ÷ 1,000
50.00
Returning buyer share
312 ÷ 780 × 100
40.0%
Count-line accuracy
368 ÷ 400 × 100
92.0%
Order fill rate
940 ÷ 1,000 × 100
94.0%
On-time delivery
864 ÷ 1,000 × 100
86.4%
Return rate
168 ÷ 2,400 × 100
7.0%
Gross margin
(52,000 − 33,800) ÷ 52,000 × 100
35.0%
DIO
67,600 ÷ 33,800 × 30
60 days
DSO
6,000 ÷ 12,000 × 30
15 days
DPO
25,350 ÷ 33,800 × 30
22.5 days
Cash conversion cycle
60 + 15 − 22.5
52.5 days
Cash runway
54,000 ÷ 6,000
9.0 months
The 32 mismatched count lines (400 − 368) do not prove that 8% of units or value is missing, or that those mismatches caused all incomplete orders. The on-time result is 86.4%, because all 1,000 due deliveries count; using only the 960 delivered would report 90% and conceal open late orders. Investigate causes by SKU, location and courier.
Working-capital calculations use the same 30-day period and consistent balances. DIO uses average inventory and cost of goods sold; DSO uses average trade receivables and net credit sales; DPO here uses average trade payables and net credit purchases. If purchases are unavailable and COGS is used as a proxy, label the approximation. The cash cycle is not a forecast of a specific bank payment date.
Dashboard design rules
Use fewer tiles on a phone, readable labels and accessible status indicators. Do not squeeze twelve tiny cards onto every screen. Show the number, context, update time and a route to permitted evidence.
Show value, baseline or agreed target, trend, sample size and last update. Missing data must look different from zero.
Choose refresh frequency for the decision. A monthly forecast may still need an event-driven refresh after a major change.
Let authorised users drill into exceptions; aggregates do not grant permission to every underlying row.
Use one versioned definition across dashboards and reports, with visible restatements when needed.
Name one accountable owner and a backup; collaboration is useful, ambiguous accountability is not.
When a KPI turns red
The dashboard is only useful if red means something. Before anyone acts, ask whether the number is wrong or the business is.
Check missing feeds, stale jobs and definition changes while protecting customers from an active operational problem. Both can be wrong at once. A sudden drop does not automatically mean a broken pipeline. Record the evidence, hypothesis, responsible person, action and review date; correct snapshots with a visible history.
Vanity metrics and other traps
Traffic is context, not profit. Judge acquisition with audience quality, cost and contribution, not conversion alone.
Revenue can rise while margin or cash deteriorates. Keep scope and time windows comparable.
Segment averages by courier, channel or location when samples are meaningful; protect personal data in small groups.
A smaller decision-focused dashboard is often easier to use, but there is no universal 12- or 20-tile limit.
Review targets and assumptions deliberately. Keep a history instead of changing old targets to make results look better.
A staged dashboard pilot
Choose a small set of decisions and write their metric contracts, including exclusions.
Agree owners, permissions, freshness and a baseline.
Compare results with source records and explain differences; test missing data and zero denominators.
Build readable views and permitted drill-downs, with definition versions.
Run a pilot review and record hypotheses, actions and review dates.
Retire a duplicate report only after reconciliation, user acceptance and retention needs are met. This is a staged plan, not a four-week guarantee.
Monday morning, again
Return to the illustrative Monday morning. The owner can now distinguish 50,000 of net order value from 52,000 of recognised revenue and see the reconciliation. Order fill rate is 94%. Suppose 41 of 60 incomplete orders mention six SKUs: that is a useful lead, not proof of a stock-count cause.
The inventory manager checks counts, reservations and pick exceptions, while operations checks dispatch constraints. If the evidence confirms a problem, they agree a correction and review the result. The benefit is an explainable decision; no fixed meeting duration or guaranteed hours saved is claimed.
Key takeaways
Define the fact, cohort and timing before writing the calculation.
Separate orders, cash collections and recognised revenue.
Report due-but-open deliveries and immature returns honestly.
Treat correlations as leads; check the evidence before choosing a cause.
Protect reporting data with permissions and visible freshness.
Use calculations to support accountable decisions, not guaranteed business outcomes.
Sources and review
Reviewed 4 November 2026. ACCA explains working-capital ratios and the cash operating cycle. IFRS 15 distinguishes revenue recognition from simply receiving an order or cash; finance should apply the relevant accounting framework. The cohorts, amounts and scenario here are editorial teaching examples, not benchmarks or a customer result.
Anichur Rahaman is a software architect and the creator of StoreConsole. He designs commerce and ERP systems for growing businesses, with a focus on event-driven architecture, data integrity and self-hosted operations.



 E-commerce