 E-commerce
Starting an Ecommerce Business: Orders, Delivery and Cash Flow
Connect ecommerce orders, stock, delivery, COD payments and customer care. A practical story with AI chat, Social Hub and room to grow into ERP.
Anichur Rahamanhá 1 dia12min

The same shelves can support different inventory values. Follow the purchases, sale timing, late freight bill and return to see which differences are legitimate.
Autor
Anichur Rahaman

At month end, two shop owners count the same 150 units on the shelf. They bought the same 300 units for 3,600 and sold 150 for 3,750. One report shows inventory 2,000 and gross profit 2,150; the other shows 1,800 and 1,950. These are illustrative USD figures, not customer results. The difference can be a valid cost-assignment policy, but it still needs an explanation.
Inventory costing allocates the cost of owned goods between what has been consumed or sold and what remains an asset. It does not change the physical count or create cash. To judge the reports fairly, align ownership, units, transaction sequence, cost inclusions and accounting policy before comparing margins.
FIFO assigns earlier acquisition costs to issues first. Weighted average blends qualifying costs; periodic averaging uses the period’s available goods, while moving average updates after relevant receipts/cost adjustments under the system’s rules. Their amounts can diverge when sales happen between receipts.
Physical picking is separate. Perishable stock may need first-expiry-first-out, FEFO, even if the accounting formula is FIFO or average. Lot/serial traceability tells you which goods moved; a serial number alone does not make an interchangeable product non-interchangeable for accounting.
The IFRS Foundation’s IAS 2 overview describes specific identification for qualifying items and FIFO/weighted average for interchangeable inventory. IAS 2 does not permit LIFO. Do not pick a method solely to inflate this quarter’s margin. Apply the approved framework and local tax rules consistently to appropriate groups of goods.
Assume no opening stock, returns, tax, loss or write-down. Buy 100 units at 10=1,000;100 at 12=1,200;100 at 14=1,400. All three lots arrive before the one sale of 150 units at 25. Total available 300 units/cost 3,600; revenue 3,750. The prices are already complete eligible unit costs.
FIFO issues 100×10+50×12=1,600. Remaining cost is 50×12+100×14=2,000. Periodic average is 3,600÷300=12, so sale cost and remaining inventory are both 1,800. With no intervening sale, moving average reaches 12 before this sale and gives the same result as periodic average.
Under each row, COGS plus closing inventory equals 3,600 and quantity remaining is 150. Gross profit is revenue minus COGS; gross margin is gross profit divided by 3,750, not a markup on cost. FIFO is higher in this particular rising-price sequence, not in every imaginable inventory history. Gross profit here excludes other operating expenses and does not prove cash generation or tax due.
| Same timeline, USD | COGS | Closing inventory | Gross profit | Gross margin |
|---|---|---|---|---|
| FIFO | 1,600 | 2,000 | 2,150 | 57.33% |
| Periodic weighted average | 1,800 | 1,800 | 1,950 | 52.00% |
| Moving average, all receipts first | 1,800 | 1,800 | 1,950 | 52.00% |
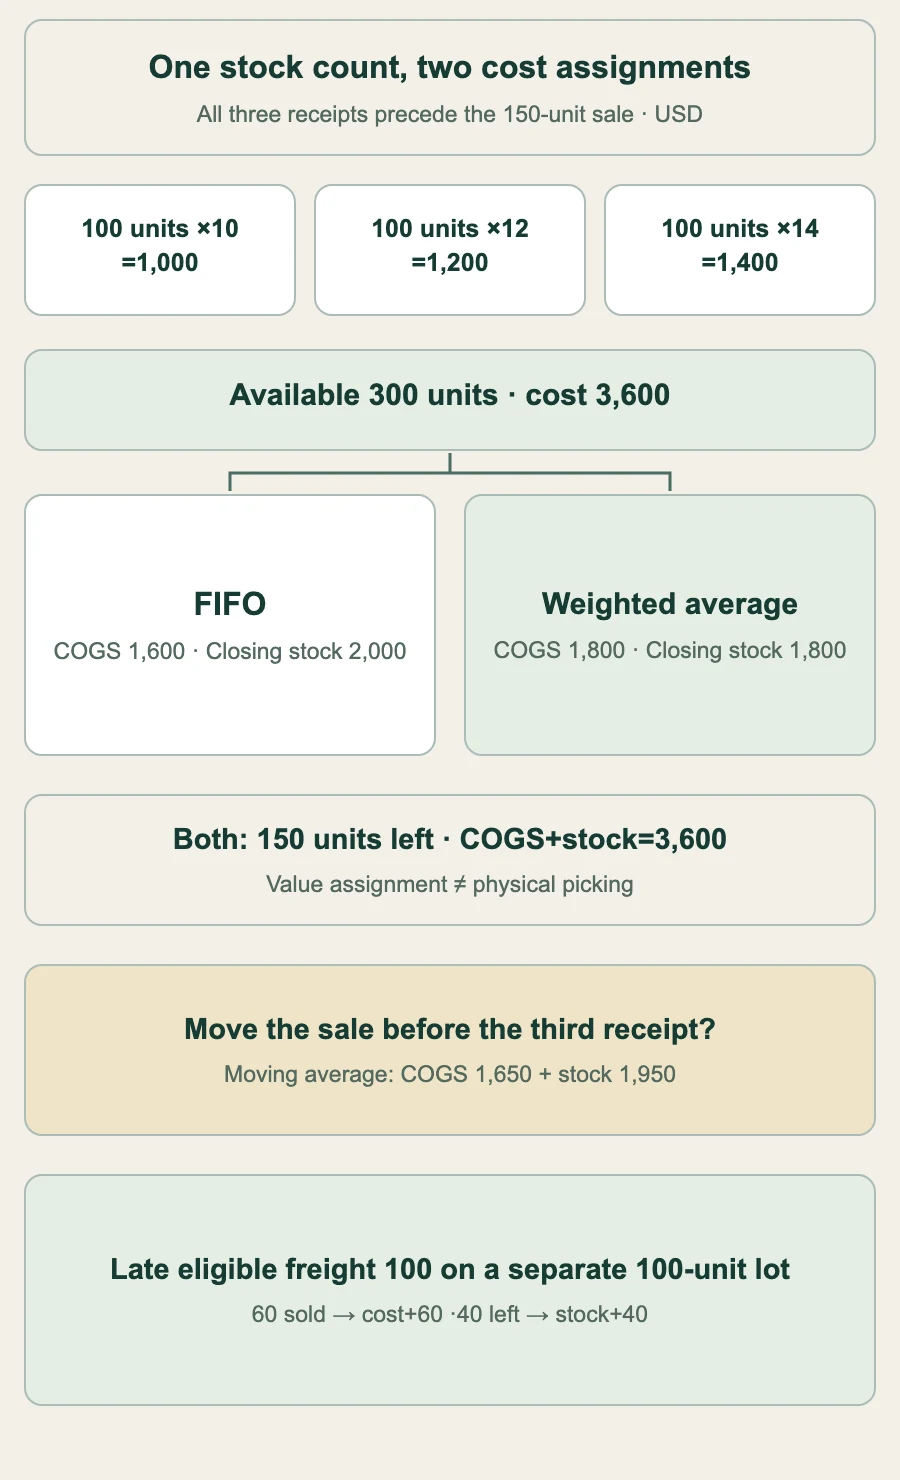
In a second timeline, receive the first two lots, sell 150, then receive the third lot. This is deliberately a different sequence. Before sale the moving average is 2,200÷200=11. Issue cost is 1,650;50 units/cost 550 remain. Adding the final 100/cost 1,400 leaves 150 units/cost 1,950 and a new average 13.
A period-end weighted average across the same period still gives COGS 1,800 and closing 1,800. Both reconcile to 3,600, but use different time bases. Do not mix the moving-average result from this sequence into a table claiming all receipts preceded sale.
Backdated receipts, supplier credits and later cost changes need an approved recosting or adjustment policy for affected subsequent issues. Keep the original transaction and correction evidence. Rounding should retain adequate internal precision and reconcile currency totals; do not silently round every intermediate average until the ledger drifts.
| Second timeline | Movement | Units left | Cost USD | Average USD/unit |
|---|---|---|---|---|
| First receipt | +100 × 10 | 100 | 1,000 | 10 |
| Second receipt | +100 × 12 | 200 | 2,200 | 11 |
| Sale between receipts | −150 × 11 | 50 | 550 | 11 |
| Third receipt | +100 × 14 | 150 | 1,950 | 13 |
For a separate 100-unit import, assume purchase price after discounts 10 per unit, inbound freight 80 total, nonrecoverable duty 50, insurance 20 and directly attributable receiving 50. Eligible total is 1,000+80+50+20+50=1,200, or 12 per unit. Recoverable tax is not part of this example’s inventory cost. At selling price 25, using 10 suggests 60% gross margin; using 12 gives 52%. The latter is still positive, so the former error does not prove every sale loses money.
The public NZ IAS 2 text reproduces the core cost and measurement principles. Check capitalisation against the applicable standard: abnormal waste, selling expenses and unrelated administration do not simply become inventory. Storage has limited exceptions; ordinary warehouse spend is not automatically a landed-cost allocation.
Allocate a shared eligible bill on a documented rational basis, such as relative weight, volume or value when appropriate. Quantity is sensible only if it fits the cost driver. Keep receipt/bill references, units of measure and allocation totals; buying one carton and selling pieces must not treat those as the same unit.
Suppose 60 of the 100 units were already sold, 40 remain, and an additional eligible freight bill 100 arrives. The extra cost is 1 per original unit: 60 belongs to sold goods’ cost and 40 to remaining inventory. Original COGS 720 becomes 780; stock 480 becomes 520; combined 1,300. Loading all 100 onto the 40 left overstates that stock by 60. Finance decides the actual period, accrual/estimate treatment and adjustment entries.
For the first FIFO example only, assume the 100 remaining units from the 14-cost lot have estimated selling price 13, completion cost 1 and necessary selling cost 1. NRV is 11. Their write-down is 100×(14−11)=300; other remaining stock is assumed recoverable at cost, so closing inventory falls 2,000→1,700. NRV includes completion costs, not just a headline resale price.
Where IAS 2 applies, reassess recoverability and reverse a qualifying recovery only up to the original write-down and no higher than cost/current NRV. If those 100 units remain and NRV rises to 12.50, their carrying value can rise by 150; total inventory becomes 1,850, not 2,150. Other frameworks/tax bases may differ. Approve and evidence the assessment instead of choosing a convenient blanket percentage.
Link the returned unit to its original issue cost and any later approved cost adjustment. Then inspect ownership, condition, recovery costs and recoverable value; historical issue cost is the starting evidence, not an automatic permission to restore full value. A partly damaged item can retain some recoverable value; “not immediately saleable” does not always mean a full write-off.
The customer refund is a separate obligation. IFRS 15 provides the revenue framework where applicable; finance must also handle return rights, refund liabilities and recovery assets appropriately. Do not simply reverse every original entry or create saleable quantity on an unverified refund request.
A supplier return similarly needs the original receipt/cost reference, approved valuation and matching credit/clearing treatment; freight, tax and exchange differences may not reverse identically. A transfer within one entity generally moves stock/cost between locations rather than creating another external sale. Cross-entity transactions need their own policy.
Periodic inventory accounting is a legitimate approach when appropriate, not automatically a guess. Perpetual records can provide more timely issue costs, but neither removes the need to reconcile physical quantities, ownership, adjustments and valuation. Goods present on the shelf may be held for someone else; owned goods may be in transit. Reservations affect availability, not automatically COGS.
Finance defines when a sale’s carrying cost is expensed consistently with related revenue/control. An order-created event is not universally that point. A qualifying supplier receipt normally adds inventory against an approved payable/receipt-clearing account, not a reversal of COGS. Selling/recognition normally debits COGS and credits inventory; returns and write-downs follow their own approved treatment.
Prevent duplicate postings, distinguish a pending accounting effect from completed stock movement and reconcile unresolved work. Negative inventory, zero-quantity cost balances, missing opening layers, unit conversion and backdated edits need explicit handling rather than a fabricated zero cost. Stock permission does not automatically include permission to see purchase costs or margins.
Unique or project-segregated items may need specific identification. Standard cost is a measurement technique, not a free choice to hide actual costs: it must approximate eligible cost with regular review and appropriate variance treatment. Do not impose a universal quarterly/yearly refresh or choose only from FIFO/average regardless of goods and framework.
IRS Publication 538 describes US tax inventory methods and changes; it is not a worldwide financial-reporting rule. Financial books and tax treatments may differ and need reconciliation. Do not assume a costing change always saves tax or that method differences inevitably disappear while the business still holds inventory.
IAS 8 separates policy changes, estimates and errors, with retrospective policy treatment subject to exceptions/transitional rules. Get finance/tax approval for the actual change. A new freight estimate or a posting correction is not automatically a new cost formula.
Rehearse the proposed method over representative receipts, interleaved issues, returns, transfers, late costs, write-downs and a closed period. Compare quantities, layer balances, COGS, adjustments and control accounts; only one authorised path posts live journals. Preserve opening history, cutoff and a recovery plan. Do not zero stock or erase old journals to make a method switch look clean.
Back with the two owners, the goal is not identical margins at any cost. Each should be able to explain its approved method and reproduce the split from the same evidence. Ask software suppliers, including StoreConsole, to demonstrate that reconciliation and its correction paths in the version and modules offered.
Reviewed 5 November 2026. Anichur Rahaman, creator of StoreConsole. All transactions, prices and assessments are teaching examples; actual reporting, tax and business policies require approval.
Sobre o Autor
Anichur Rahaman
Continuar Lendo