Exam Night Was Evidence, Not a Capacity Guarantee — NovaCommerce 5
Two real exams, one scale-in mistake and a useful planning model. The final case review separates observations, extrapolation, operating costs and tests still owed.
On 7 October 2026, two exams ran back to back. The case record shows 661 starts and 638 submissions in one, 439 starts and 425 submissions in the other. Then a pool minimum was lowered mid-exam: a serving node disappeared without the expected drain, and roughly 360 requests failed in two minutes. Both the working service and that failure belong in the result.
NovaCommerce is an anonymised course-and-exam platform. This final part retains existing September–October observations, recalculates the published arithmetic and states what remains unproved. It is not a newly repeated load test or a StoreConsole benchmark.
Read the tests by what they actually exercised
The investigation found an IP-keyed limiter on 25 September, Valkey connection failures in a 6 October run and backend CPU saturation for the tested request mix. Different causes required different changes. “More servers” was appropriate for some capacity pressure, not a replacement for correct identity or a working shared service.
The records include a frontend run of about 356 requests/s, p95 0.05 s, zero reported errors; a GET-based autoscale run on 5 October reaching roughly 750 requests/s, no reported server errors/timeouts but about 4% HTTP 429; and a 25–500 ramp with zero application errors but 143 load-balancer errors. Those runs have different mixes and scopes. Do not combine their best figures into one successful throughput claim.
The guarded rollout later had 219 probes, every two seconds, with zero errors. That is useful sampled evidence, not proof that every request, write or long connection survived. A full business-flow test must validate authenticated answer acceptance, durable receipts, safe retries and final results, not merely HTTP status or a fast cached home page.
A real evening exposed a different failure
638/661 rounds to 96.5%; 425/439 to 96.8%. These are submission proportions, not availability percentages. Non-submission may have several causes; the counts do not attribute every missing submission to a technical failure or establish zero data loss.
The case reports backend peak roughly 69 requests/s from minute logs, versus 63 on a provider two-minute aggregation. Pool CPU peaked at 47% on the reported average while one node reached 86% for a minute. MySQL CPU max was 24.5%, average 13.4%; worker max 46% with zero recorded failed jobs. Keep aggregation windows and denominators visible. Zero failed jobs does not mean no pending or lost work.
The old CPU estimate was about 59 ms/request. At 63 requests/s that is 3.717 CPU-seconds/s; divided by eight vCPU, about 46.5%. Its proximity to 47% is a consistency check under those assumptions, not proof of causation or linear scale. The scale-in incident showed why readiness, per-node load and retirement need separate evidence. The exam-hours runbook was a human control, not an enforced prohibition.
Use a model to choose the next test
The historical planning model assumed 50 backend requests/s per node, baseline traffic of 30 requests/s, a 1.3 imbalance factor, 15 opening requests/student and 0.025 requests/s per present student. Treat 50 as a hypothesis for the same request mix and an agreed latency target, not a proven universally safe limit.
For N healthy nodes, student budget is N×50÷1.3−30 requests/s. With a 600-second join window, each student contributes 15÷600+0.025=0.05 requests/s. With 120 seconds, it is 0.15. For four nodes, (4×50÷1.3−30)÷0.05≈2,477; the teaching table rounds down to 2,400. This is a fluid average model: bursts, uneven arrival, pauses and correlations can still exceed it.
The 1.3 divisor is this planning factor, not a claim of 30% idle capacity or automatic node-failure coverage. Model the loss of a node separately. Rows above the observed few-node tests are extrapolations, not certified student capacity. PDF uploads, worker queues, database contention and provider limits are outside this backend model. Low database CPU does not establish a 450 requests/s ceiling or sixfold headroom.
Healthy backend nodes
Model budget requests/s
600-second join: rounded students
120-second join: rounded students
2
≈77
900
300
4
≈154
2,400
800
6
≈231
4,000
1,300
Describe the architecture with its open risks
The historical design had independent frontend/backend pools, minimum two and maximum ten each; primary/standby MySQL; shared Valkey; separate PostgreSQL/pgvector; object storage; and backend logs in OpenSearch. One fixed worker still hosted queues, scheduling, WebSockets and SMS. That worker remained a single point of failure; frontend log shipping and worker standby were planned.
A replicated database, stateless web nodes and images improve particular recovery paths. They do not make every dependency redundant or protect against a regional failure, a bad deployment, unauthorised access or erroneous deletion. Test write fencing and restore separately. Old frozen data is not current rollback after new writes; image rollback also requires compatible schema, sessions and queued payloads.
Add the bill before comparing it
The listed historical monthly web items total $272: backend $112 + frontend $56 + worker $56 + two balancers $48. Data and logs total $709: MySQL $389 + Valkey $240 + PostgreSQL $60 + OpenSearch $20. Adding snapshots $5 and Spaces base $5 gives $991 before variable usage. The old “about $990” was rounded, not an exact invoice.
The earlier $416 described the web tier including powered-off recovery Droplets; it was not the old full-stack cost. Compare $416 with $272 only after confirming identical scope and service assumptions, not with the new combined $991. This list excludes staffing, support, taxes, provider AI/SMS, overages and temporary rollout/peak capacity; it is not total cost of ownership or a current quote.
Check current provider plans and account eligibility. The MySQL Standard changes described in Part 3 make the historical pair unsuitable as an unchecked 2026 buying recipe. A bigger reliability budget can be worthwhile, but only a comparable service and full operating model support a savings claim.
Historical monthly group
Listed subtotal
Scope
Web tier
$272
2 backend +2 frontend +worker +2 balancers
Data and logs
$709
MySQL +Valkey +PostgreSQL +OpenSearch
Snapshots and storage base
$10
$5 +$5; usage extra
Listed combined base
$991
Before usage, staffing, taxes and other services
The next acceptance gate is still real work
A formal multi-hour soak and full mixed write-path load test remained planned in the record. The two-hour exam observation was not a controlled soak. A 24-hour no-local-write observation does not rule out memory leaks, connection growth or growing queues. Do not silently relabel those gaps “passed”.
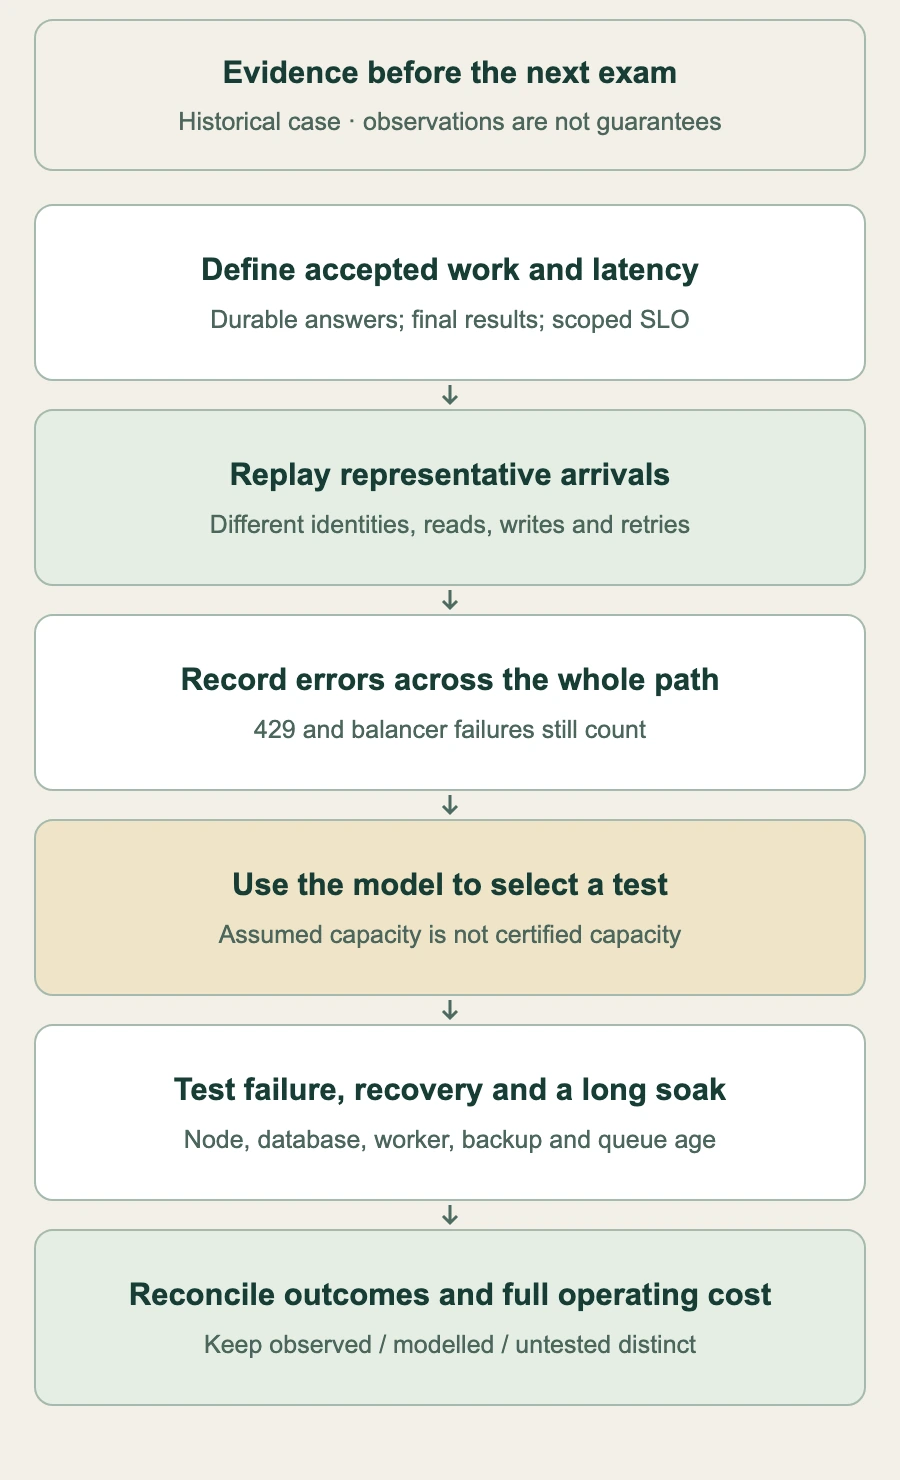
Before another larger event, agree successful-answer and latency thresholds; use representative identities and arrival shape; test duplicate submissions and deadline behaviour; sustain long enough to observe memory, connections, storage and oldest-job age. Include node failure, safe scale-in, database reconnect/failover, worker recovery and backup restoration. Capture tool versions, scripts, resource settings, errors and accepted-work reconciliation. Run disruptive tests in an isolated representative environment or an approved window with stop criteria.
The series ends with a usable decision loop: measure the business outcome, locate the constraint, change the relevant layer, then re-test the outcome and recovery. Its most valuable artifact is an evidence register that can say “observed”, “modelled” or “not yet tested” without confusing them.
A plan for obtaining the next evidence, not a claim those tests already passed. Capacity rows are model outputs; the cost table is historical base spend.



 Infrastructure & Scaling