 ई-कॉमर्स
Social Media से Sales: Campaign, Scheduling और AI Prompts
Social Hub से content schedule और Meta campaigns review करें। चार AI prompts के साथ ecommerce और ERP records से marketing का असली परिणाम समझें।
Anichur Rahaman3 घंटे पहले7मिनट
Sales, inventory, delivery और cash metrics के सही cohorts, formulas और exceptions समझें। उदाहरण में हिसाब है, बिना सबूत कारण के दावे नहीं।
लेखक
Anichur Rahaman

सोमवार सुबह। एक report में net order value 50,000 है, दूसरी में recognised revenue 52,000। मालकिन “numbers ठीक करो” कहने से पहले पूछती हैं: दोनों ने क्या गिना? बैठक का सवाल बदल जाता है—नए chart से पहले definition चाहिए।
यह समझाने के लिए बनाया गया दृश्य है, customer case study नहीं। काम का dashboard numbers और उनसे जुड़े decisions समझाता है। Missing definition को और charts नहीं सुधार सकते।
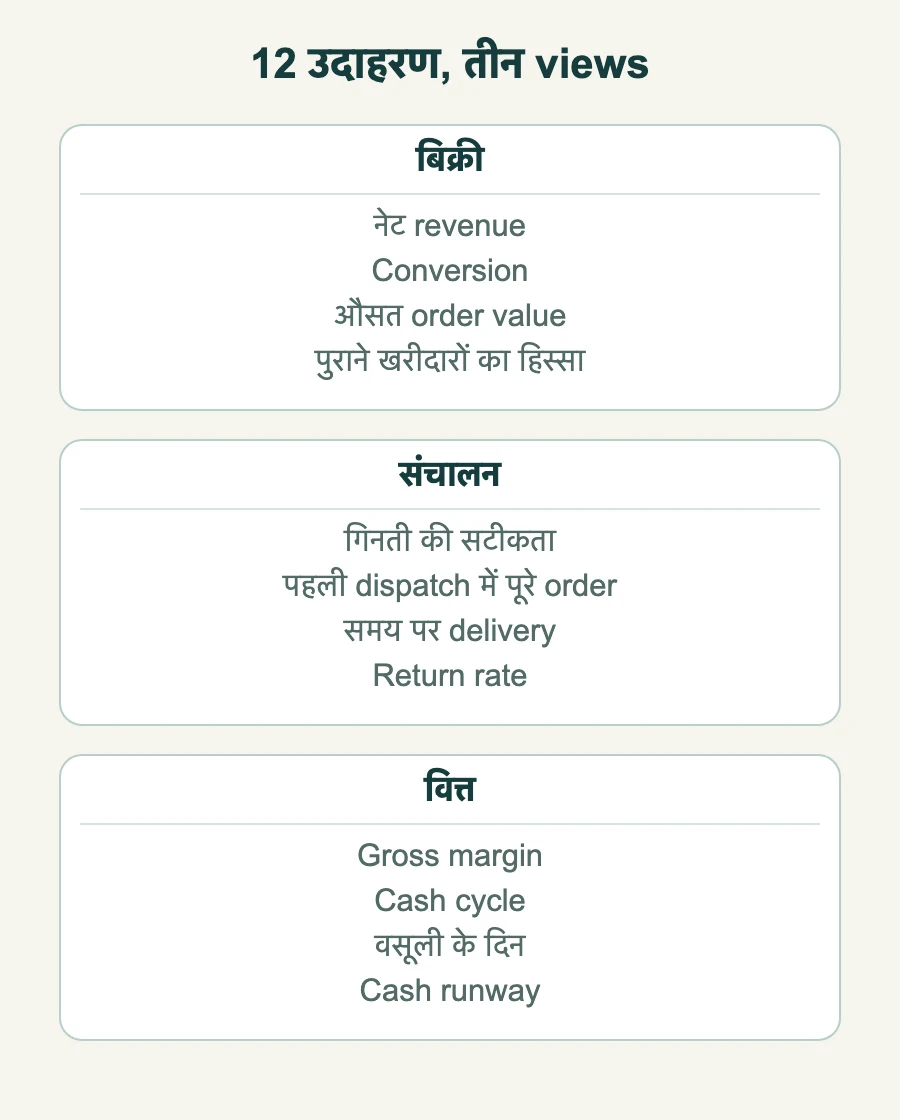
2026 की इस guide में बारह संभावित metrics हैं, हर dashboard का तय आकार नहीं। हर metric की definition, scope, accountable owner और decision तय करें। Worked example से समझेंगे कि red tile जाँच शुरू करता है, कारण साबित नहीं करता।
दो dashboards अलग facts मापें तो अंतर हो सकता है: accepted orders, collected payments या recognised revenue। हर अंतर गलती नहीं। सही नाम दें, timing और exclusions reconcile करें; तीनों को “sales” कहकर बराबर न बनाएँ।
Metric contract लिखें: numerator, denominator, cohort, time zone, currency, exclusions, source, freshness और version। Query definition लागू करती है, business decision की जगह नहीं लेती। Revenue और cost policy finance approve करे; order या payment status अकेले recognised revenue नहीं तय करता।
एक trusted definition governed reporting model में इस्तेमाल हो सकती है; सभी modules की tables सीधे join करना ज़रूरी नहीं। Snapshot और live view दोनों सही हो सकते हैं, अगर lineage, access limits और freshness स्पष्ट हों। Calculation time और missing inputs दिखाएँ।
Definition version रखें। बदलने पर trend का break दिखाएँ या documented method से history restate करें। अलग series चुपचाप न तुलना करें। Reporting store में भी role/location scope चाहिए; data पास होने से cashier को salary, सारे margins या सभी customers का access नहीं मिलता।
Financial results पूरा हो चुका काम बताते हैं; operational signals आगे की जाँच में मदद करते हैं। Conversion या stock accuracy भविष्य का profit सुनिश्चित नहीं करते। Metrics का संबंध evidence जाँचे जाने तक hypothesis है।
Sales, operations और finance अलग सवालों के जवाब हैं। Demand अच्छी हो और fulfilment कमज़ोर, या revenue बढ़े और cash फँसे—दोनों संभव हैं। Overview को menu मानें और असली decision के लिए metrics चुनें।
Safety, service, privacy और compliance controls का फ़ायदा तुरंत profit में न मपे, फिर भी वे ज़रूरी हैं। हर non-financial metric सजावट नहीं। हर visible metric का purpose, owner और उचित response हो।
नीचे के बारह metrics की अपनी definition चाहिए। Rate formulas percentages दिखाते हैं। पहले cohort तय करें; denominator zero हो तो “लागू नहीं”, अपने-आप zero performance नहीं। खराब orders चुपचाप cohort से न हटाएँ।
| KPI | फ़ॉर्मूला | कितनी बार | ज़िम्मेदार |
|---|---|---|---|
| नेट रेवेन्यू | Finance-approved recognised net revenue; tax, discount और return policy तय। | रोज़ | सेल्स हेड |
| Conversion | Purchasing sessions ÷ eligible sessions × 100। | रोज़ | ई-कॉमर्स लीड |
| Average order value | Eligible orders की net value ÷ उन्हीं orders की संख्या। | रोज़ | ई-कॉमर्स लीड |
| Returning buyer share | Period से पहले order वाले buying customers ÷ period के buying customers × 100। | हफ़्ते में | मार्केटिंग |
| Count-line accuracy | Matching SKU-location count lines ÷ checked lines × 100। | हफ़्ते में | inventory मैनेजर |
| Order fill rate | First dispatch में complete orders ÷ first dispatch due eligible orders × 100। | रोज़ | ऑपरेशंस लीड |
| On-time delivery | Promise तक delivered orders ÷ promise due सभी eligible orders × 100। | रोज़ | ऑपरेशंस लीड |
| Return rate | उसी defined mature cohort के returned units ÷ fulfilled units × 100। | हफ़्ते में | ऑपरेशंस लीड |
| Gross margin | (Recognised net revenue − COGS) ÷ recognised net revenue × 100। | हफ़्ते में | फ़ाइनेंस |
| Cash conversion cycle | DIO + DSO − DPO; समान period और consistent bases। | महीने में | फ़ाइनेंस |
| DSO | Average trade receivables ÷ net credit sales × period days। | महीने में | फ़ाइनेंस |
| Cash runway | Usable unrestricted cash ÷ forecast monthly net cash burn; burn positive हो तभी। | महीने में | मालिक |
Order fill rate और unit fill rate अलग हैं। Count-line accuracy stock-value accuracy नहीं। On-time delivery में due लेकिन अब तक न पहुँचे orders भी आएँ, वरना सबसे बुरी delays छिप सकती हैं। Return window पूरी होने तक cohort को provisional बताएँ।
यह invented currency units वाला teaching example है, industry targets नहीं। Financial period 30 दिन है और operational cohorts अलग परिभाषित हैं। Net order value 50,000 और recognised revenue 52,000 अलग measures हैं। Cash cycle के लिए ज़रूरी DIO और DPO components भी नीचे अलग दिखाए गए हैं।
| Metric | हिसाब | नतीजा |
|---|---|---|
| Conversion | 1,000 ÷ 40,000 × 100 | 2.5% |
| Average order value | 50,000 ÷ 1,000 | 50.00 |
| Returning buyer share | 312 ÷ 780 × 100 | 40.0% |
| Count-line accuracy | 368 ÷ 400 × 100 | 92.0% |
| Order fill rate | 940 ÷ 1,000 × 100 | 94.0% |
| On-time delivery | 864 ÷ 1,000 × 100 | 86.4% |
| Return rate | 168 ÷ 2,400 × 100 | 7.0% |
| Gross margin | (52,000 − 33,800) ÷ 52,000 × 100 | 35.0% |
| DIO | 67,600 ÷ 33,800 × 30 | 60 दिन |
| DSO | 6,000 ÷ 12,000 × 30 | 15 दिन |
| DPO | 25,350 ÷ 33,800 × 30 | 22.5 दिन |
| Cash conversion cycle | 60 + 15 − 22.5 | 52.5 दिन |
| Cash runway | 54,000 ÷ 6,000 | 9.0 महीने |
400 − 368 = 32 mismatched count lines। इसका अर्थ 8% units या value गुम होना नहीं, न ही यही सभी incomplete orders का कारण साबित होता है। On-time result 86.4% है क्योंकि सभी 1,000 due deliveries गिनी गई हैं। सिर्फ़ 960 delivered से 90% आएगा और open late orders छिपेंगे। SKU, location और courier के हिसाब से जाँचें।
Working-capital में वही 30 दिन और consistent balances लें। DIO में average inventory और COGS; DSO में average trade receivables और net credit sales; यहाँ DPO में average trade payables और net credit purchases हैं। Purchases न मिलें और COGS proxy लें तो approximation लिखें। Cash cycle किसी bank payment date का forecast नहीं।
Phone पर कम tiles, पढ़ने योग्य labels और accessible status दें। हर screen में बारह छोटे cards न भरें। Value, context, update time और permitted evidence का रास्ता दिखाएँ।
dashboard तभी काम का है जब लाल का कोई मतलब हो। कोई कुछ करे, उससे पहले सवाल यह है: आँकड़ा ग़लत है या कारोबार?
Missing feeds, stale jobs और definition changes जाँचें, साथ में customers को सक्रिय operational समस्या से बचाएँ। दोनों एक साथ ग़लत हो सकते हैं। अचानक गिरावट अपने-आप pipeline failure नहीं। Evidence, hypothesis, responsible person, action और review date लिखें; snapshot correction का इतिहास रखें।
उसी illustrative Monday पर लौटें। Owner 50,000 net order value और 52,000 recognised revenue अलग समझकर reconciliation देख सकती हैं। Order fill rate 94% है। मानें 60 incomplete orders में 41 उन्हीं छह SKU से जुड़े हैं: यह lead है, stock-count cause का proof नहीं।
Inventory manager counts, reservations और pick exceptions देखें; operations dispatch constraints जाँचे। Evidence समस्या दिखाए तो correction और review तय करें। फ़ायदा समझाने योग्य decision है, तय meeting duration या guaranteed hours saved नहीं।
समीक्षा: 4 नवंबर 2026। ACCA working-capital ratios और cash operating cycle समझाता है। IFRS 15 में revenue recognition सिर्फ़ order या cash मिलने से अलग है; finance लागू accounting framework अपनाए। Cohorts, amounts और scenario teaching examples हैं, benchmarks या customer results नहीं।
अनिचुर रहमान सॉफ़्टवेयर आर्किटेक्ट और StoreConsole के संस्थापक हैं। वे बढ़ते कारोबारों के लिए कॉमर्स और ERP सिस्टम डिज़ाइन करते हैं — ख़ास ध्यान event-driven आर्किटेक्चर, डेटा की शुद्धता और अपने सर्वर पर चलने वाले सिस्टम पर।
लेखक का परिचय
Anichur Rahaman
पढ़ना जारी रखें